Because you’re systemically under-estimating the impact of luck, good and bad, coming in sequence connected across time. You need 4.38 times bigger profit margins than you believe, in order to correct for this (in the example given below). Or you need to collaborate with other startups in an ecosystem; then you’re fine.
The same applies to every decision in your entire life.
And this is a huge reason to believe we can build regenerative, net positive, positive impact and profitable businesses.
Think of a startup founder, about to accept a new customer. Think of their investor, who decided a week earlier to accept this new startup into their portfolio. Now keep things simple: there’s a 50% chance that the sales decision is wise; the client pays, and the startup grows its bank balance; but there’s a 50% chance that the client declines to pay, and the startup loses the entire cost of sale.
What should the margin be for the startup to grow, on average, by a mere 5% per sale? The statistics you learn in business schools and investment programmes tells you, for example, that if you price such a 50-50 chance so that you grow your bank balance by 50% when the client pays (say from 1000 to 1500), and lose 40% (say from 1000 to 600), it’s a good deal. You base your business plan on this, yielding a 5% growth rate for each sale. (The average of a 50% gain vs. 40% loss, 50-50 for each, is 5%: (1.5+0.6)/2 – 1 = 2.1 / 2 – 1 = 0.05 = 5%)
You validated your business plan, giving you confidence that you can repeat these probabilities each day for a year, taking the initial investment to 54 billion on average. Your investor agrees with this, and adds you to their portfolio.
But everything you’ve learnt about probability is wrong for such a sequence of decisions, and causes you to get negative results. You go bankrupt, and your investor loses their 1000. You both blame your incompetence as a founder.
But that’s not true. The problem is with how you calculated. Actually, to get a 5% average growth, for a fixed 50-50 chance and 40% loss, you need a whopping 83.8% growth for each success. Not 50%.
Why? You, and almost everyone who uses the conventional statistics taught at university, have failed to see the hidden connections across time in such a sequence of sales events in one company. And between companies.

You need to think differently, because the connections are as important as the dots. You are using naive dot statistics when you need connected statistics.
Like a child’s join the dots drawing, in your life, all our businesses and investments, it’s the lines joining the dots that make all the difference. The same set of dots connected by different lines makes a completely different image—or life.
If you’re an investor, entrepreneur, or anyone living the one life you have, you only have one sequence of decisions connected across time. Not discrete dots. Whatever your decisions about what to invest your time, money, energy etc. in, you need connected statistics, not dot statistics, to understand the real risks you face.
Good news: if you ignore your training and just go with intuition you are more likely to get it right!
Investors today use Modern Portfolio Theory (MPT), coupled with the Efficient Market Hypothesis and the Capital Asset Pricing Model to take decisions to deliver a desired risk / return ratio.
This approach is even more broken than most people realise, because it sees, and hence decides based on, the dots (companies) but not the lines (connections with companies and stakeholders, and across time). They’ve lost what they learnt in kindergarten, that it’s the lines that make the drawing above work.
So, even though many in mainstream investing and in the ESG, impact etc. space have tried to come up with new tools to improve the old, and outdated, model; along with recent efforts to add AI and big data; few address the fundamental issue of looking through the wrong lenses in the first place. (Details one section down.)
Connected / sequential vs. independent decisions
Most aspects of economic and business theories assume that you can expect the same average outcome for one person taking 100 sequential choices or 100 people making the same choice independently. For example, the average of you tossing one coin a hundred times is the same as the average of a hundred people tossing a coin once each. All too often this is false, as introduced in section 6.4 of the book Rebuild: the Economy, Leadership, and You by myself and Jack Reardon. (If this encourages you to buy it, release 1.1.0 is due out on 31 March. It has been expanded to cover more of this blog.)
And join our webinar on Tuesday 30 March: https://www.eventbrite.co.uk/e/webinar-3-rebuild-the-economy-leadership-and-you-tickets-141974791423 or watch the video afterwards on our book website above.
The reason is simple: if there is a real-world consequence of a decision, it can change the whole game. For example, say the decision is whether to accept or refuse a business opportunity. If you accept the opportunity, exactly half the time your choice grows your bank balance by 50%, and the other half of the time you lose 40%. Most of you will look at this and decide that it’s rational to take the opportunity, because you are 5% better off, on average.
You are wrong, if this is a sequence of business opportunities across time. In that case you are certain to lose money long term (around an average of -5% each toss). You are taking the wrong decision, because the probability you studied is based on an assumption (no connections across time) that fails to hold, for two reasons.
- Whilst 50% gain and 40% loss averages at 5% gain if they are independent, which means you add them to get the average (1.5+0.6 = 2.1 => 5% average gain), if they are in sequence they are connected and must be multiplied: 1.5*0.6 = 0.9 => 5.1% average loss.
- In a sequence, if you have a run of bad luck, your balance is too small and the business folds. You are out of the game.
Take a simple (but actually quite realistic in business decisions) toy example: everything driving gain or loss is purely random, no skill or information is relevant other than pure probability. Your bank balance starts at 1000, grows by 50% if the coin lands heads, and drops by 40% if it lands tails. Economics and business theory teaches that the rational decision is to accept the opportunity.
This is realistic because, as Paul Ormerod has shown (see his book Why things fail) unpredictable fortune is a really good explanation of business results. If you are investing in a portfolio according to MPT, you are making the false statistical assumption that the sequence of business decisions in each company are independent, and that the connections between companies are irrelevant.
Compare the two images below. The first shows a portfolio investment, where each company is a stand-alone business. At each cycle the company grows 50% or contracts 40% with equal probability. You learnt, in your statistics course at university, that the portfolio will grow on average by 5% each cycle; and so if you play the game long enough and it will tend toward the dotted black line.
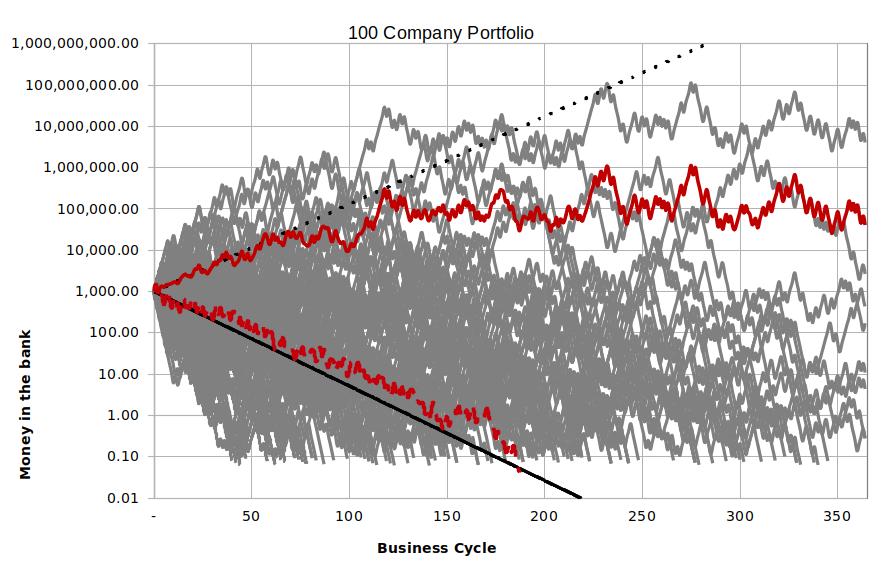
This simulates 100 independent companies in your portfolio over 365 business cycles (coin tosses), each starting with your investment of 1000 in the bank. At each cycle, if the cash in the bank drops below 0.1, the company declares bankruptcy and drops out of your portfolio. By the end 92 of your companies are bankrupt.
Your portfolio average (solid red line) looks good, almost all from two companies, and to exit with a profit you must get the timing right. You guess right, take your money, and conclude that focussing on a portfolio big enough to have a unicorn, and exiting at the top, is the best investment strategy. Or you guess wrong and lose all your money. (How many VC funds look like this, do not consistently generate positive returns for their limited partners, and need to be both big and exit on time to generate returns?)
However, everything here is a random fluke. The company that delivers high returns is purely a random high outlier in a general downward trend, and will collapse, at the latest in a few hundred cycles. Because the standard statistics you were taught, predicting an average growth of +5% per cycle, and that are typically used in MPT, do not apply and cannot predict the average losses of around -5% per cycle you actually see. The solid black line is the correct prediction for statistics where the sequence in time is important. The dotted red line shows the median company in this sample, i.e, half the companies are better than, and half are worse than this company.
If you want to get the 5% average growth that naive dot statistics erroneously leads you to expect, you actually need to be offered (at -40% for each tail) over 4x bigger benefit: +83.8% instead of only +50% for each head.
Ecosystem investing theory (EIT) recognises that sequential decisions are connected in time, making the outcomes quite different, and uses the right statistics for sequential decisions. EIT predicts correctly that, even though the +50% or -40% gamble is rational in the naive statistics of MPT, it is irrational in real life; and then EIT shows how to change the game to make it rational again, and a good gamble!
So how does an ecosystem change the dynamics to one that—even in a purely random toy model—delivers top class returns for your investments? Simply put, in an ecosystem the interdependency of all the companies is made part of the dynamics, structurally and systemically, enabling all companies to consistently tap into the random runs of good fortune of each company, benefitting everyone, including the investor.
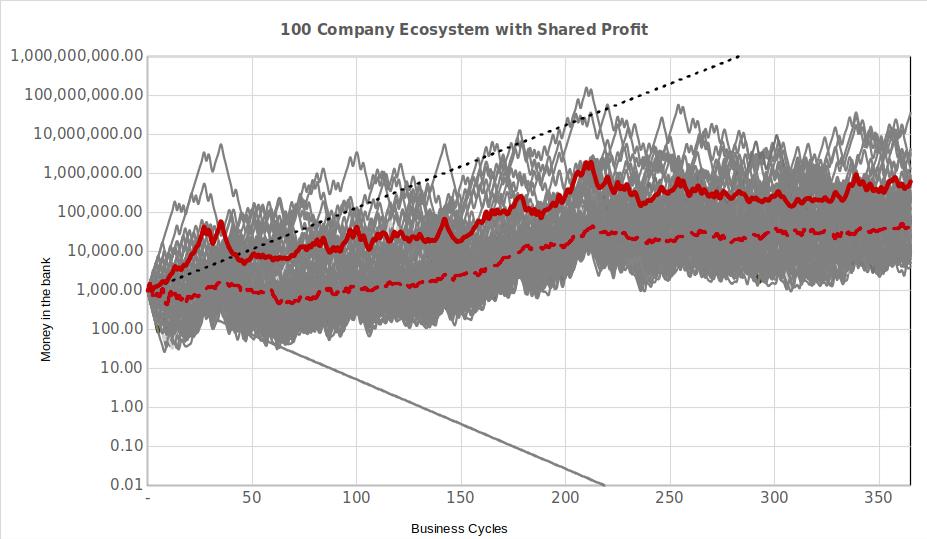
In the simplest ecosystem of 100 companies, after each cycle those companies that randomly got lucky and grew by 50% put 1% of their gain into a pot; and then the pot is divided equally to each company, including those companies that grew. So the lucky profitable typically donate only 0.5% of their winnings to the unlucky loss-making. As you can see in this diagram, this leads to zero bankruptcies, every company has delivered a positive multiple of your initial 1000 investment, and 20% of the companies are as big as, or even 10x bigger than, the biggest company in your portfolio above. The middle company is doing as well as the unicorn outlier in the portfolio above. The final EIT average is a 1000x multiple on the initial investment, and a million times the portfolio average.
There is only one difference between these two simulations: a portfolio of independent companies vs. an ecosystem of interdependent companies that support each other. And it is only in the equations. There are no values, ethics, or morals involved. Pure maths. And that is enough to change the dynamics.
This second simulation better reflects, across your investment, real business dynamics: companies are interdependent, i.e., connected to each other, heavily affected by completely unpredictable outcomes, and the decisions are connected over time in a sequence.
If you invest in business ecosystems your investment stays reliably healthy long after a portfolio has become quite sick. .
How does it work? By the lucky sharing their gains it takes the entire ecosystem’s game back towards the simple positive average of the original naive statistics!
Imagine how much better this gets when skill, information, and mutual synergy is included. Perhaps this is one reason why large multinational companies perform so much better than they ought to (at least, from what I’ve seen of their internal losses): a single company with 20 billion dollar brands and many smaller ones, spread across different business units, has many characteristics of an ecosystem. A run of good luck in one brand can support another brand for a while; and vice-versa when the run of luck switches.
What does this mean for your investment decisions, and the entrepreneurs turning your investment into results? How do you and they get better results, whether financial or impact outcomes? Two types of connections must become part of our investment decisions:
- shift from portfolios to ecosystems: the lines connecting the multiplicity of stakeholders and companies; and
- accept sequential decisions: the lines connecting today’s decisions with tomorrow’s decisions mean the game is not what we think it is.
Portfolios vs. Ecosystems
Regardless of which portfolio theory (Modern, Sustainable, Maslowian, etc.) you use to fill your investment portfolio, you are leaving money and impact lying on the table, and carrying needlessly high risk, because there is no, or only a shallow relationship between the companies in your portfolio. You cannot maximise effectiveness and efficiency across your entire portfolio, because the companies are not designed to reflect the actual relationships and interactions in the economy. The levers needed for ecosystem-level optimisation are not installed. Even worse, investors and business leaders are tricked into behaviours that destroy value across the whole market place, and therefore in your portfolio too.
The rapidly emerging alternative is ecosystem investing. It yields systematically lower risk for a given return, and higher return for a given risk. Ecosystems are built to optimise the entire ecosystem, and do so because all the inherent relationships (of resources, products, value flows, etc.) are reflected in the shareholder relationships between the companies.
Four characteristics of a natural ecosystem need to be in the incorporation / share structure so that companies form a business ecosystem with all the levers needed to increase performance (whether performance is purely financial or also impact, circularity, regenerative etc. outcomes).
- All capitals and their stakeholders in an appropriate balance of power.
- Common DNA.
- Common metabolic pathways / value exchange channels.
- Blended collaboration and competition.
This optimises at the ecosystem level, where collaboration works with competition as a complementary pair, not an either-or choice, yielding far better and more robust results than optimising each company, because each company trusts the other companies long-term (as they have governance rights in each other) and benefits from the long-term success of each other (as each earns a share of the surplus generated by the others, based on how much they contribute to the ecosystem thriving).
This leads each company to take investment and operating decisions that maximise the success of all companies together. All for one and one for all. As is illustrated below, a portfolio of independent companies has a higher risk and lower return, on average, than an ecosystem in the same business conditions, especially over longer investment horizons relevant for, e.g., pension funds and many family offices.
Building ecosystems
Ecosystem investing requires a slight extension of the standard company, because the primary element of an ecosystem is relationships between all stakeholders, yet the standard company building block excludes all but investors from maximising the power of their actual relationship with the company.
It is time to incorporate individual companies, as described in this blog, so that all stakeholders, including companies that have some kind of interdependency, form an ecosystem satisfying all four criteria above. Then the investors in the ecosystem have, and each company has, the levers needed to minimise entire ecosystem risk and maximise ecosystem efficiency. Making the investment in the ecosystem beat any portfolio investment long term.
Companies incorporated to form ecosystems have multiple share classes, all carrying governance rights, dividend rights, and perhaps capital gain rights. Only one class (investor) can be bought for money; the remaining classes are earnt through contributing at the ecosystem level. For example, a supplier might earn supplier shares by going beyond the transactional minimum.
In the statistics section you saw how, in a realistic toy model with only unpredictable events (And, hand on heart, what percentage of the important events shaping your portfolio or business can you reliably predict? You’ll need to be close to 100% for dot statistics to work.), after long enough:
- every portfolio losses all the money invested;
- with the right balance of collaboration and competition, every ecosystem has a positive RoI under the same business conditions.
Key Conclusions:
These will all be the focus of the book Jack and I are writing next, after Rebuild.
- Connections across time matter, so decisions in sequence deliver different outcomes to the same decisions in parallel.
- Companies and stakeholders have inherent relationships. Your business performs better if you can optimise both these connections and your internal operations (i.e., your own dot).
- We look too much at the dots, not enough at the connections between the dots. We need to develop new lenses to see these connections and how they can invert the rules of the game.
- The game of business we are actually in is very different to the one we think we are in.
- A blend of a little collaboration and lots of competition in this toy model outperforms pure competition 10x on average, 1,000,000x for the median. This 1,000,000x boost across all companies is a massive enabler to do more than we currently imagine possible in addressing our climate, environment’s, and society’s problems.
- Ecosystems of multi-capital, multi-stakeholder interdependently incorporated companies is the way to build circular economies, regenerative economies, or stakeholder capitalism.
- The investors and entrepreneurs with the best results in the next decade will put their time and money into ecosystems, not portfolios.
Additional Indications:
- Each taxi driver in Uber is a line in this graph, and shows why such non-collaborative non-sharing economy business models are fatally flawed for the drivers and the investors long term. The odds in such non-collaborative endeavours must be way better than in a collaborative true sharing economy to even break even.
- This applies to everyone: your whole life is a sequence of choices about investing time, effort and money, and driven by the little-known statistics in the figures above. The lines also represent 100 babies born with equal intrinsic potential; but some experience less advantage, others more advantage (e.g. due to race, postcode, etc.) and so their lives diverge.
- In particular this shows how the first country to introduce a working UBI will begin consistently outperforming other nations.
- It indicates that the more community-oriented the country is the more it will thrive in unpredictable, chaotic times. (Sound like today, anyone? Is this why individualistic England has 1500x the Covid death rate of collaborative Thailand?)
- The way traditional communities, whose wisdom developed from generations of experience of the consequences of sequential decisions about life, intuitively use the right statistics, and take the right decisions. But are then labelled irrational by economists trying to fix their flawed foundations.
Learn how to do this using the FairShares Commons incorporation, in conjunction with powerful adaptive ways of organizing work and developing people in Rebuild: the Economy, Leadership, and You by myself and Jack Reardon. And join us in our online programmes; e.g. Jack’s economics course will spend a good amount of time on this, register here: https://www.evolutesix.com/workshops
Jack and I are writing the next book during the year, and this will be a key theme in the next book.
For those who want to know more about the statistics: each of our lives, and business, is composed of non-ergodic processes (the sequence in time matters); but economics, business theories, and much of what we learn at school or university assumes everything is ergodic (the sequence in time is irrelevant) and so we use fundamentally wrong statistics to estimate whether we are likely to gain or lose from our decisions. Those who’ve never studied these disciplines tend to make better decisions because they intuitively understand non-ergodic processes.
(Connect the dots image by mazeo from https://openclipart.org)
Key references: Ole Peters, The ergodicity problem in economics; Ole Peters and Murray Gell-Mann, Evaluating gambles using dynamics; Ole Peters and Alexander Adamou, An evolutionary advantage of cooperation.